
This is the story of a strategy we almost recommended. It’s a trend-following Expert Advisor on gold (XAUUSD, 4-hour bars). On five years of data it passed every rule we have. It also matched the MetaTrader 5 tester trade by trade. Then we tested it on eleven years, and most of the edge was gone.
We are publishing it because the failure teaches more than the success would have. If you build or buy EAs, the trap it fell into is probably waiting for yours too.
The strategy in one paragraph
The EA is a classic trend follower. A long-period exponential moving average sets the direction. ADX checks that a trend is actually present. MACD and RSI time the entry. The stop loss is a multiple of ATR, and the take profit sits at a fixed risk/reward of 2.5. Every trade risks a fixed percentage of the account. Nothing exotic: rules like these appear in hundreds of trading books and forum threads.
We did not choose the settings by hand. The walk-forward engine picked them in every window from a grid of more than 1,600 combinations. It optimised on the previous 12 months and then traded the next 3 months with the settings frozen. Every result below includes spread and slippage, and every entry happens on the bar after the signal, as it would live.
Five years: everything passed
On the 2021–2026 dataset the walk-forward ran 16 out-of-sample windows, each 3 months long. These are the results, counting only trades the strategy had never seen during optimisation:
| Metric | Result (2021–2026, out-of-sample) |
|---|---|
| Net profit (100k account) | +53,893 |
| Profit factor | 1.53 |
| Trades | 174 |
| Max drawdown | 7.0% |
| Windows on a parameter plateau | 14 of 16 |
| Fixed-parameter variants beaten | 83% |
Each line answers a different question.
- Profit factor 1.53 after costs is a solid result. It isn’t the suspicious 3.0 you see in curve-fitted backtests.
- A 7% drawdown leaves room for prop-firm rules.
- 14 of 16 windows on a plateau means the chosen settings had good neighbours. The result did not depend on one magic combination. (We explain plateaus in the Strategy Lab.)
- Beating 83% of fixed variants means re-optimising every quarter actually added something. Picking any reasonable setting and leaving it alone would have done worse.
Our showcase rules ask for all of these, and the strategy cleared every one.
The MT5 check: does the EA do what the research says?
A research result is only useful if an EA can reproduce it. So we exported the strategy to MQL5 and ran the last window in the MetaTrader 5 strategy tester with the same parameters the research had chosen.
Ten of the twelve research trades opened in MT5, eight of them on exactly the same bar. The remaining differences came from small differences between the broker’s price data and ours. Profit in the tester was about +8,500 with real ticks and about +8,900 with OHLC bars, very close to the research. As far as we could tell, the engine and the EA agreed.
This step matters more than most people think. Along the way it caught two real problems in our own engine. The first was that entries happened on the signal bar instead of the next one. The second was that indicators started computing from scratch at the beginning of each window, while an EA live has years of history behind it. We fixed both before running the numbers in this article.
The question we almost didn’t ask
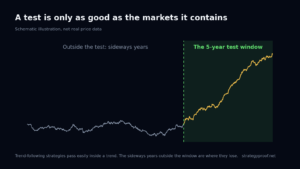
At this point the strategy looked ready. But one thing bothered us: 2021–2026 was an exceptional period for gold. The price rose strongly, with long, clean trends. A trend-following strategy tested on a trending market proves very little.
So before publishing we wrote down a pass/fail rule in advance, and then tested on a longer history going back to 2015. The rule:
- Profit factor at least 1.2
- Maximum drawdown at most 20%
- No two-year period losing more than 10%
Writing the rule down first matters. Once you have seen a result, it is very easy to find reasons why it is “actually fine”.
Eleven years: the edge mostly disappears
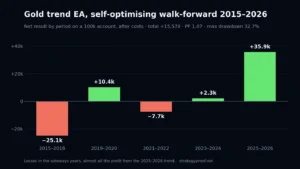
We built a self-optimising version of the EA. Every quarter it repeats the same selection the research engine makes: it looks at the previous 12 months, tests the same 1,617 combinations with the same filters and the same costs, and trades the best one for the next 3 months. It’s the walk-forward, done live inside MetaTrader. We ran it from 2015 to 2026.
| Period | Net result (100k account) |
|---|---|
| 2015–2018 | −25,100 |
| 2019–2020 | +10,400 |
| 2021–2022 | −7,700 |
| 2023–2024 | +2,300 |
| 2025–2026 | +35,900 |
| Total 2015–2026 | +15,570 · PF 1.07 · max DD 32.7% |
The total is still positive, but look at where the money comes from. Almost all of it was made in 2025–2026, the strongest gold trend in the sample. From 2015 to 2018, when gold mostly moved sideways, the strategy lost money year after year. A 32.7% drawdown would have ended any prop-firm account and most people’s patience.
It failed all three pre-committed criteria. We also tried a variant with a longer training window (24 months of training, 6 months of trading), in case 12 months was too short a memory. It finished around −6,000. Fiddling with the walk-forward settings did not rescue it, and we stopped there. Searching for a setting that does rescue it would be curve fitting at a higher level.
A second test: freeze the parameters
We also took the parameters chosen for the most recent window and ran them, unchanged, from 2020 onwards. The result was +42,000 with a profit factor of 1.23 and a drawdown of 26.6%. That sounds better, until you split it. From 2020 to 2024 the same parameters lost about 5,700. Again, nearly all the profit came from the last strong trend.
What actually went wrong
Nothing was broken: no bug, no look-ahead, no data error. The strategy does exactly what it was designed to do. It makes money when gold trends strongly and gives it back when gold doesn’t.
The five-year test wasn’t wrong either. It correctly reported how the strategy behaved in that market. It just didn’t contain a market the strategy hated. Every robustness check we ran (walk-forward, plateau, fixed variants, Monte Carlo) measures stability inside the data it receives. None of them can warn you about a regime that isn’t in the data.
That is the real lesson: a test is only as good as the variety of markets it contains.
Five practical rules we took from it
- Check that your history contains the enemy. For a trend-following strategy, the enemy is a long sideways market. For mean reversion, it is a strong trend. If your test window has none, you haven’t really tested the strategy yet.
- Write the pass/fail rule before you look. Profit factor, drawdown and the worst sub-period, all fixed in advance.
- Look at results by year, not only the total. A healthy total can hide years of losses carried by one exceptional period.
- Don’t rescue a failed test by changing the test. Changing the window length, the timeframe or the grid until the result improves is optimisation on the full history: the very thing walk-forward is meant to prevent.
- Use regime-dependent strategies inside a portfolio, not alone. A trend follower that loses in sideways years can still be useful next to a strategy that does well in sideways years. That is a portfolio decision, not a reason to trade it on its own.
So is the EA useless?
Not necessarily, but it is not what the five-year test suggested. It is not a stand-alone strategy that works in any market. It is a trend component that pays off in trending years and costs money in the others. Used that way, with a small risk, next to uncorrelated strategies and with clear alarm thresholds, it can have a place. Sold as “PF 1.5, 7% drawdown”, it would be misleading.
That is why the strategy appears in our showcase with the label “Passed 2021–2026 · not robust on 11 years”, and not as a recommended EA.
Frequently asked questions
Isn’t a 5-year walk-forward enough?
It depends on what those five years contain. Five years with a full cycle of trends, ranges and volatility shocks can be enough. Five years of one dominant regime is not, however many windows you split it into. Count regimes, not years.
Why not just optimise on the full 11 years?
Because then the result would show how well the settings fit the past, not how well the method adapts to the future. The walk-forward, and the self-optimising EA that repeats it inside MT5, only ever uses data that was available at the time of each decision. That is the only kind of result that tells you something about live trading.
Would a regime filter have saved it?
Maybe, and it is the obvious next experiment. But a filter added after seeing the 2015–2018 losses is fitted to those losses. To be a fair test, the filter has to be defined first and then validated on data it was not designed on. Otherwise you have just moved the curve fitting one level up.
Does this mean trend following doesn’t work on gold?
No. It means this specific trend follower makes its money in strong trends and loses in long ranges. That is true of most trend-following systems. They are profitable over long horizons only if the winning years pay for the losing ones, and you have to survive the losing years to collect them. Whether you can depends on your risk size, your drawdown limits and what else is in your portfolio.
How do I check my own EA for the same problem?
Run the walk-forward on the longest history you have, then look at the out-of-sample result by year. If one or two exceptional years carry the whole total, you have found the same pattern. The Strategy Lab shows the result window by window, so you can see it at a glance.
Try it on your own strategy
Everything in this article (walk-forward with costs, plateau map, fixed-variant comparison, Monte Carlo, prop-firm simulator) is available in the Strategy Lab. You can run your first research for free. Then do what we should always do: find the market your strategy hates and test it there.
See the full case in the showcase → Open the Strategy Lab →
Research and education only. Not investment advice. Past results, in a backtest or live, do not guarantee future results.