
Almost every backtest you have ever seen answers the wrong question. It shows how well a set of settings fits a stretch of history that the trader already knew when picking those settings. That number says a lot about the trader’s patience and very little about the strategy’s future.
Walk-forward analysis answers a different question: if you had followed this method in real time, choosing settings only from data available at the time, what would have happened? It is the closest thing to a live track record you can build from historical data. That is why we call it the only backtest that counts.
This article explains how walk-forward analysis works, what to look at in the results, and where its limits are. No maths beyond arithmetic is needed.
The problem walk-forward solves
Suppose you have a trend strategy with three settings: a moving average length, an ADX threshold and a risk/reward ratio. You try a few hundred combinations on five years of data and pick the best one. The equity curve is beautiful.
The trouble is that the best combination was chosen because it fitted those five years. Some of its performance is a real edge. Some of it is the strategy matching the noise in that particular history: a lucky entry before a big move, a stop that happened to sit just outside a spike. You cannot tell the two apart by looking at the curve, because both were used to choose the settings.
This is the in-sample problem, and we look at it more closely in In-Sample vs Out-of-Sample: Why Your Backtest Is Lying. Walk-forward analysis fixes it with a simple discipline: the data that chooses the settings is never the data that judges them.
How a walk-forward actually runs
A walk-forward cuts history into a sequence of overlapping pairs. Each pair has a training window (in-sample), where the optimiser is allowed to look, and a test window (out-of-sample) that immediately follows it, where the chosen settings are traded without changes.
Our default in the Strategy Lab is a 12-month training window, a 3-month test window and a step of 3 months. On roughly five years of data (2021–2026) that gives 16 out-of-sample windows. The process looks like this:
- Optimise on months 1–12. Pick the best combination by your chosen rule.
- Freeze those settings and trade months 13–15. Record every trade.
- Move everything forward by 3 months. Optimise on months 4–15.
- Freeze and trade months 16–18.
- Repeat until the data runs out.
At the end you stitch the 16 test periods together. The result is one continuous equity curve made only of trades the optimiser had never seen when it chose their settings. That stitched curve is the walk-forward result.
Notice what is being tested. It is not one set of parameters. It is the method: “every quarter, look at the last year, choose by this rule, trade the next quarter.” The parameters may change from window to window. That is allowed, and in fact it is the point.
Reading a walk-forward result
The stitched curve gives you the usual numbers: net profit, profit factor, number of trades, maximum drawdown. Read them with costs included, or they mean little; every research in the Lab adds a standard trading cost automatically.
As a real example, here is the out-of-sample result of a trend strategy on gold (T01, XAUUSD H4), chosen in each window from a grid of more than 1,600 combinations:
| Metric | Out-of-sample, 2021–2026 |
|---|---|
| Net profit on a 100k account | +53,893 |
| Profit factor | 1.53 |
| Trades | 174 |
| Max drawdown | 7.0% |
| Windows on a plateau | 14 of 16 |
| Fixed variants beaten | 83% |
| Risk/reward 2.5 chosen | 13 of 16 windows |
The first four lines are the familiar ones. The last three are what walk-forward adds, and they are often more informative than the profit.
Is each choice stable?
In each training window, the chosen combination either sits on a plateau (its neighbours also perform well) or on a peak (it is good and its neighbours are not). A peak is usually noise. Counting how many windows chose from a plateau tells you whether the optimiser kept finding robust regions or kept chasing spikes. More on this in Peak vs Plateau: Reading a Parameter Map.
Does re-optimising add anything?
Compare the walk-forward with every fixed combination traded over the same out-of-sample periods. If re-optimising every quarter does no better than picking any reasonable setting and leaving it alone, the method is not adding value. In the gold H4 case it beat 83% of the fixed variants.
Do the choices agree with each other?
If the optimiser picks wildly different settings every quarter, the strategy has no stable preference and is probably following noise. In the gold case, a risk/reward of 2.5 was chosen in 13 of 16 windows. That kind of consistency is a good sign.
Walk-forward vs the alternatives
There are other ways to test a strategy, and each answers a narrower question.
| Method | What it shows | Main weakness |
|---|---|---|
| Single optimised backtest | How well the best settings fit the past | Every trade was used to choose the settings |
| One in-sample / out-of-sample split | One honest test period | One period, one regime, easy to re-use by accident |
| Walk-forward analysis | How the selection method would have performed in real time | Only covers the regimes in the data |
| Live or demo trading | Real execution, real costs | Slow: years to collect enough trades |
A single split is better than nothing, but it gives you one sample. Walk-forward gives you many, each with its own market conditions, and it repeats the exact decision you would face live: “what do I trade next quarter?”
Choosing the settings of the walk-forward itself
A walk-forward has its own parameters: training length, test length, step, the selection rule, and whether the training window rolls or grows. Each choice has trade-offs, and we cover them in How to Choose the Train and Test Window Length and the article on anchored versus rolling windows.
The most important rule is simple: choose these settings before you look at the result, and do not change them to rescue a bad one. If you try five window lengths and keep the best, you have optimised again, just one level higher. We follow this ourselves. When a 24-month train, 6-month test variant of the gold strategy came out at about −6,000 and failed our pre-committed criterion, we stopped instead of searching for a window length that worked.
What walk-forward cannot tell you
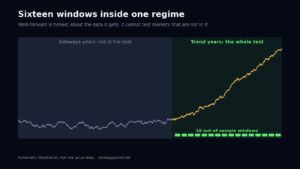
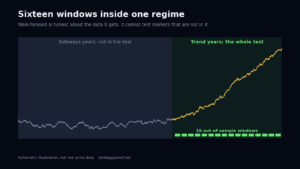
Walk-forward is honest about the data it receives. It cannot warn you about markets that are not in that data.
The gold H4 strategy above is the clearest example we have. On 2021–2026, a period of strong gold trends, it passed every check. We then ran a self-optimising version in MT5 that repeats the same quarterly selection from 2015 to 2026. The total was +15,570 with a profit factor of 1.07 and a maximum drawdown of 32.7%. From 2015 to 2018, when gold mostly moved sideways, it lost 25,100. Most of the profit came from 2025–2026. The full story is in our gold EA case study.
The five-year walk-forward was not wrong. It accurately reported how the method behaved in a trending market. It simply contained no long sideways market, which is where a trend follower suffers. So keep three limits in mind:
- Regimes, not years. Sixteen windows inside one regime are not sixteen independent tests of every condition.
- Costs and execution. A walk-forward without realistic spread and slippage can be badly misleading. On gold H1, the same kind of strategy made +94,000 without costs and about +5,000 with them.
- Engine correctness. If the backtest engine enters on the signal bar, or starts indicators cold in each window, the walk-forward inherits those errors. We found both problems in our own engine by checking against MT5 and fixed them (next-bar entries on 6 Oct 2026, indicator warm-up on up to 1,500 bars on 8 Oct 2026).
A practical checklist
Before trusting any walk-forward, yours or someone else’s, go through these questions:
- Were the walk-forward settings fixed before the first run?
- Are costs included, and are they realistic for the timeframe?
- Does the result come only from out-of-sample trades?
- How many windows chose from a plateau rather than a peak?
- Did the walk-forward beat most fixed variants over the same periods?
- Is the profit spread across windows, or carried by one or two?
- Does the history include the regime this strategy should hate?
Our showcase applies several of these as hard rules: at least 11 of 16 windows on a plateau, a walk-forward that beats at least 80% of the fixed variants, and all results after costs.
Frequently asked questions
Is walk-forward analysis the same as forward testing on a demo account?
No. Forward testing means running the strategy in real time on new data, which takes months or years. Walk-forward analysis simulates that process on historical data by never letting the optimiser see the period it is judged on. It is much faster, but it cannot capture live execution details such as your broker’s fills, which is why a later check in MT5 or on demo is still worth doing.
Can a walk-forward result be overfitted?
Yes, at the level of the walk-forward itself. If you run many walk-forwards with different grids, window lengths or strategy variants and publish the best, the result is again the best of many tries. The protection is to decide the setup in advance and to report every attempt, including the failures.
Why does the walk-forward choose different parameters in each window?
Because each window is optimised on a different year of data, and markets change. Some variation is normal. What matters is whether the choices cluster in a stable region, and whether the method as a whole beats simply holding one setting fixed.
Do I need to re-optimise live if I use walk-forward?
To trade exactly what the walk-forward tested, yes: every step you repeat the same selection on the most recent training window. An alternative is to freeze the latest parameters, but then you are trading something slightly different from what was tested, and you should check how those fixed settings behave on their own.
Run your own walk-forward
The Strategy Lab runs a full walk-forward with costs on any of 90 official datasets, then shows the plateau count, the comparison against fixed variants and the result window by window. Start with a strategy you already trust and see whether it still looks the same when it has to choose its settings blind.
Open the Strategy Lab → See what passed the showcase rules →
Research and education only. Not investment advice. Past results, in a backtest or live, do not guarantee future results.