
Curve fitting is what happens when a strategy learns the past instead of a pattern. The rules bend until they pass through every lucky bounce and avoid every painful drop in the historical data. The backtest looks wonderful. The future, which never saw those exact bounces, does not cooperate.
The good news is that curve fitting leaves fingerprints. You don’t need a statistics degree or a week of testing to spot most of them. If someone sends you an EA report, or you have just finished an optimisation run yourself, five minutes and a short list of questions will tell you whether to keep going or to be very suspicious.
This article is that list. It won’t prove that a strategy is good. Nothing does that in five minutes. But it will catch the most common ways a backtest flatters itself.
What curve fitting actually is
Every price series contains two things: some structure that may repeat, and a lot of noise that won’t. A strategy with enough adjustable parts can always describe the noise too. Give it a moving-average length, an RSI threshold, a session filter, a day-of-week filter and a stop in pips, and an optimiser will find a combination that happens to dodge the worst losing trades of the last few years.
Those dodges are not skill. They are the strategy memorising which specific Tuesdays were bad. When the next Tuesday comes along, the memory is useless, and the strategy’s real edge (if it has one) is much smaller than the backtest suggested.
The key point: curve fitting is not a yes/no property. Every optimised strategy is fitted to its data to some degree. The question is how much of the backtest result is structure and how much is memorised noise. The checks below estimate that ratio from the outside.
Minute 1: look at the equity curve
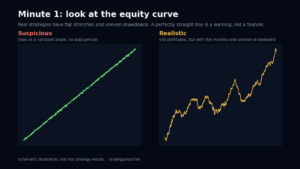
Real strategies have ugly equity curves. They have flat stretches lasting months, sharp drawdowns, and periods where nothing works. Markets change character, and a fixed set of rules can’t be in tune with all of them.
Red flags in the curve:
- A near-straight line rising at a constant angle for years. Markets don’t hand out returns that evenly. A line that smooth usually means the rules were tuned until every bad stretch was filtered away.
- No losing quarter across several years of history. Possible for some very short-term strategies before costs, rare after them.
- Drawdowns that all look the same size, as if the optimiser had found the exact stop that clips each one. Real drawdowns vary a lot.
Then compare the curve with the market. If the strategy made money in every year, including the years when the instrument behaved completely differently, ask how. A trend follower that profits in a long sideways market, or a mean-reversion system that profits through a strong trend, needs an explanation. “The optimiser found it” is not one.
Minute 2: look at the statistics that are too good
Some numbers are so rare in honest, out-of-sample testing after costs that seeing them in a backtest should raise your guard immediately.
| Statistic | Typical honest range | Raise an eyebrow at |
|---|---|---|
| Profit factor after costs | about 1.1 to 1.6 | above 2.5 to 3 on hundreds of trades |
| Win rate with risk/reward around 2 | about 30% to 45% | 70% or more |
| Max drawdown vs annual return | drawdown often half or more of a year’s return | tiny drawdown with a large return |
| Losing months | a third or more is normal | almost none |
These ranges are rules of thumb, not laws. A strategy can legitimately sit outside them. But each one outside the range is a question that needs an answer.
For a reference point, the gold trend strategy in our case study produced a profit factor of 1.53 with a 7.0% maximum drawdown over 16 out-of-sample windows, after costs. That is a good result, and it still turned out to depend heavily on one kind of market. A backtest showing a profit factor of 3 with a 3% drawdown should face a much higher burden of proof than that.
Minute 3: look at the parameters
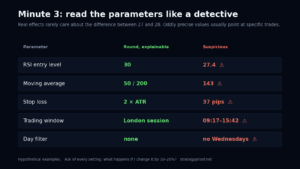
Open the settings and read them like a detective.
- Oddly precise values. An RSI threshold of 27.4, a moving average of 143, a stop of 37 pips, a trading window from 09:17 to 15:42. Real effects don’t usually care about the difference between 27 and 28. If the strategy does, it is probably fitted to specific trades.
- Too many filters. Count the conditions that must all be true before a trade opens. Every additional filter removes some losing trades from the backtest, and with enough filters you can remove almost all of them. We go deeper into this in How Many Parameters Is Too Many?
- Filters with no story. “No trades on Wednesdays” or “skip March” might be real, but they are far more often a patch over a few bad trades in the backtest.
- Asymmetric rules. Different settings for longs and shorts, or for each instrument, double or triple the number of things fitted.
A useful habit: for each parameter, ask “what would happen if I changed this by 10 to 20%?” If the honest answer is “I don’t know”, that is the next thing to test.
Minute 4: count the trades and check the costs
A strategy with 40 trades over five years and eight parameters has very little evidence per decision. With so few trades, a handful of lucky winners can produce an excellent-looking total. As a rough guide, you want hundreds of trades for a multi-parameter strategy, and the result should not collapse if you remove the three best ones.
Try that last test right now if you have the trade list. Sort trades by profit, delete the top three, and recompute the total. If the strategy goes from strongly positive to flat, its result rests on a few events, not on a repeatable edge.
Then check the costs. Many reports are produced with zero or fixed tiny spreads and no slippage. Short-timeframe strategies are especially vulnerable here, because the cost per trade is large compared with the profit per trade. On our data, the same kind of gold strategy on H1 made about +94,000 on a 100k account in walk-forward before costs and about +5,000 after realistic spread and slippage. A strategy fitted without costs is fitted to an imaginary market.
Minute 5: ask what was tested out-of-sample
This is the most important question, and the easiest to ask: was any part of this result produced on data the optimiser never saw?
If the whole backtest is the optimisation period, then the report shows how well the settings fit history, and almost nothing about the future. Curve fitting is invisible inside the data that was fitted. It only becomes visible outside it.
What you want to see, in order of strength:
- A walk-forward test, where settings are chosen on a training window and then traded on the following unseen window, repeated many times. Our default is 12 months of training, 3 months out-of-sample, stepped every 3 months, which gives 16 out-of-sample windows on five years of data. It is the closest a backtest gets to trading live.
- A single held-out period, at least clearly separated from the optimisation period. Weaker, because one period can be lucky, but far better than nothing.
- Nothing. Then treat every number in the report as an upper bound.
Watch out for a subtle trap here: an “out-of-sample” period that was looked at several times while the strategy was being developed is no longer out-of-sample. If the developer changed the rules after seeing it, the out-of-sample period quietly became part of the training data.
Beyond five minutes: the checks that confirm it
The quick checks tell you whether to be suspicious. Confirming curve fitting, or ruling it out, takes a few more tests:
- Parameter map. Plot the result across neighbouring settings. A broad area of decent results (a plateau) suggests structure. One bright spot surrounded by poor results (a peak) suggests fitting. Our tool marks each walk-forward window as plateau or peak, and our showcase rules require at least 11 of 16 windows on a plateau. See Peak vs Plateau.
- Fixed-variant comparison. Compare the walk-forward with simply picking each setting and never changing it. If re-optimising doesn’t beat most fixed choices, the method isn’t adding much. The showcase rule is beating at least 80% of fixed variants.
- Longer and different history. Run it on years that weren’t used during development, ideally ones with a different market regime.
- Monte Carlo on the trade list, to see how much the drawdown depends on the order of trades.
A worked example
Suppose you are sent this hypothetical report: EURUSD M15, 2022–2025, net +38% per year, profit factor 2.9, win rate 74% with a 1:1.5 risk/reward, 210 trades, max drawdown 4%. The settings include an RSI period of 11, an entry level of 23.5, a session filter from 07:40 to 11:10, and no trading on Fridays. Costs: a fixed 0.5 pip spread, no slippage. No out-of-sample period is mentioned.
Run the list. The statistics are far outside the honest ranges (minute 2). Several parameters are oddly precise and the Friday filter has no explanation (minute 3). The cost model is optimistic for M15 (minute 4). There is no out-of-sample result at all (minute 5). Four out of five checks fail. That doesn’t prove the strategy is worthless, but it means the report contains no reliable information about its future, and nobody should risk money on it until it has gone through a proper walk-forward with realistic costs.
Frequently asked questions
Is curve fitting the same as overfitting?
In trading the two terms are used almost interchangeably. Both describe a model that fits the noise in its training data. “Curve fitting” is the traders’ name, “overfitting” the statisticians’. Some people use curve fitting for any optimisation, good or bad, and overfitting only for the harmful kind.
Is all optimisation curve fitting?
All optimisation fits the data to some degree, so some fitting is unavoidable. The goal is not zero fitting but fitting that survives contact with unseen data. Walk-forward testing measures exactly that by keeping the decision and the evaluation on separate data.
Can a strategy with few parameters still be curve fitted?
Yes. If you tried hundreds of simple strategies and kept the best one, the selection itself is a form of fitting, even if the winner has only two parameters. We cover this in The Best of N Backtests Problem.
What if the seller shows a live track record?
A live record is out-of-sample by definition, which is valuable. Check its length, whether it includes costs and real execution, and whether it is one account among many where only the best was shown. A few months of live trading is a small sample.
Test it properly
The five-minute check tells you where to look. The Strategy Lab does the longer part: walk-forward with costs included automatically, a plateau/peak map for every window, and a comparison against every fixed variant. Run a strategy through it in the Strategy Lab, or see what a passing result looks like in the showcase.
Research and education only. Not investment advice. Past results, in a backtest or live, do not guarantee future results.